The total amount of private household spending is increasing year by year worldwide. However, this growth is extremely unevenly distributed. Here are the top (or worst?) ten countries when it comes to consumption growth distribution in the past decade.
Life is expensive. We have to spend money almost every day: on food, public transportation, housing, or recreational activities. The good news: The total amount of private household spending is increasing year by year worldwide. Over the last ten years, global household final consumption expenditure has increased by more than 18 trillion dollars – from $46.5 trillion in 2010 to $64.8 trillion in 2020.
The bad news: This growth has been extremely unevenly distributed. It has exacerbated inequality between the different regions of the world and between poorer and richer households. The figures are frightening.
The rich got even richer
The most financially demanding sources of private household expenditure in wealthy countries are housing, food, mobility and leisure. However, there are major differences: The poorer a household, the larger the share of housing expenditure. By contrast, the wealthier a household is, the more it spends on leisure.
Over the past decade, overall household final consumption expenditure has increased worldwide by slightly over 3% per year. The Brookings Institute – a nonprofit public policy organisation – has calculated who has benefited from this growth. The institute uses World Bank data from 167 countries. Private households are divided into four groups: the poor, the vulnerable, the middle class and the rich.
Around the globe, the middle class experienced the largest increase – 52% of the total spending gains. The vulnerable group saw around one third of the spending growth. The rich, making up only 2% of the global population, got 13% out of the headline growth. The poor got the least: They gained just 1% of the total spending increment in the world in the last ten years.
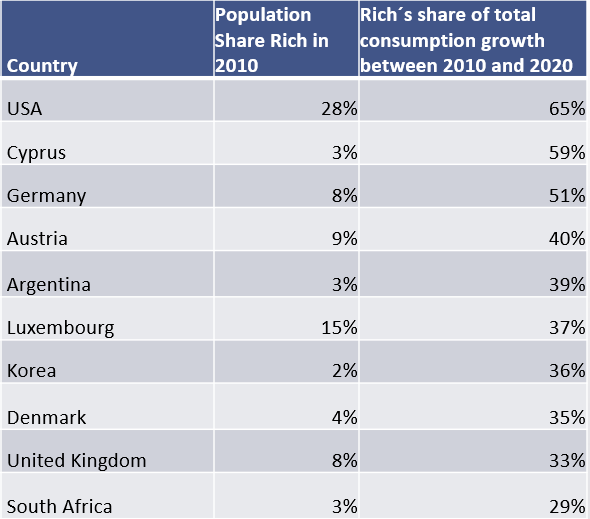
Worst ten countries in household consumption distribution
This unequal distribution can be attributed to two main factors: geographical distribution and the distribution of income. Households in North America, where only 5% of the world´s population live, gained 17% of the spending growth. Asian households (32% of the population) saw 40% of the increment. Every other region received less than its population share. Sub-Saharan Africa got the smallest share: 13% of the global population live there and yet only experienced 0.6% growth per year.
As a second factor of the unequal distribution, the rich got a disproportionate share of the growth in many countries. At the inglorious top is the USA: The rich (28% of the Americans in 2010) gained almost two-thirds of the spending increase. Here are the top (or worst?) ten countries when it comes to consumption growth distribution in the past decade: